[cs_content][cs_section parallax=”false” separator_top_type=”none” separator_top_height=”50px” separator_top_inset=”0px” separator_top_angle_point=”50″ separator_bottom_type=”none” separator_bottom_height=”50px” separator_bottom_inset=”0px” separator_bottom_angle_point=”50″ _label=”Section 1″ style=”margin: 0px 20px;padding: 45px 0px;”][cs_row inner_container=”true” marginless_columns=”false” style=”margin: 0px auto;padding: 0px;”][cs_column fade=”false” fade_animation=”in” fade_animation_offset=”45px” fade_duration=”750″ type=”1/2″ style=”padding: 0px;”][x_image type=”none” src=”http://beeline.marketing/wp-content/uploads/2016/08/title-1.jpg” alt=”” link=”false” href=”#” title=”” target=”” info=”none” info_place=”top” info_trigger=”hover” info_content=””][/cs_column][cs_column fade=”false” fade_animation=”in” fade_animation_offset=”45px” fade_duration=”750″ type=”1/2″ style=”padding: 0px;”][cs_text]
Getting New Clients For $5 or Less
(a 6 day mini-course)
[/cs_text][/cs_column][/cs_row][/cs_section][cs_section parallax=”false” separator_top_type=”none” separator_top_height=”50px” separator_top_inset=”0px” separator_top_angle_point=”50″ separator_bottom_type=”none” separator_bottom_height=”50px” separator_bottom_inset=”0px” separator_bottom_angle_point=”50″ _label=”Section 2″ style=”margin: 0px 40px;padding: 0px;”][cs_row inner_container=”true” marginless_columns=”false” style=”margin: 0px auto;padding: 0px;”][cs_column fade=”false” fade_animation=”in” fade_animation_offset=”45px” fade_duration=”750″ type=”1/1″ style=”padding: 0px;”][cs_text]
Day 6: Upward (improving ROI)
Before we talk about ongoing improvement, you need to spend a few minutes reviewing the new campaign to be sure it’s complete.
When you’re done reviewing, you’re ready to go live – hit unpause!
Every two to four weeks, you should log-in to your Adwords account and check on your campaign so you can see if it’s doing well and improve it, or decide it’s not helping and pause it.
So how do you know how well your campaign is performing?
In order to analyze the performance of your campaign, you need to understand how to read the data. Here is what it looks like:
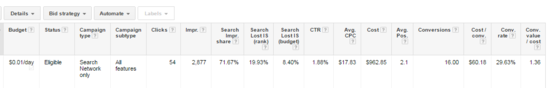
If your campaign is brand new, then wait at least 2 weeks to allow the campaign to run; you should get enough data in that time to let you know how to improve.
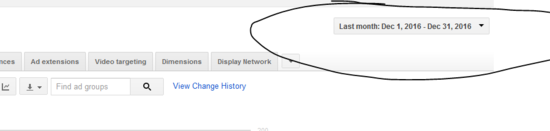
Before I explain the data, however, we need to consider the date range. I suggest you look at the last 30 days. See here for where you can adjust that date range:
Next you need to select the columns that will be most helpful to understand how your campaign is performing. Each column title has a small box with a “? in it — if you click on that box, you’ll get more info. about what each metric means. I suggest you set your columns to show the following (and hide the rest):
Budget
Status
Campaign Type
Campaign Subtype
Clicks
Impr (Impressions)
Search Impr Share
Search Lost IS (rank)
Search Lost IS (budget)
CTR
Avg CPC
Cost
Avg Pos (Position)
Conversions
Cost/ conv
Conv rate
Conv. value / cost
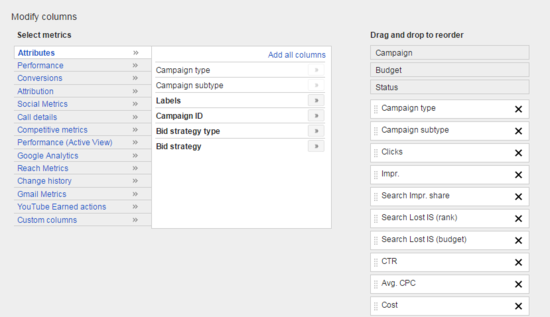
In order to change which columns you can see, click here on the columns box:
Then you will see this screen. On the very right (highlighted/in white) are the columns you currently have selected; to remove one just click the ‘X’. You can access the available columns (center) from the menus on the very left. Use the above picture to adjust which columns to select, and which to remove.
Here is what each of these data points mean for your campaign, and how to use the data to improve your campaign.
Budget – the campaign’s daily budget
- *Advanced trick – if you want to pause a campaign, instead of pausing it, lower your daily budget to $.01 instead. It has been shown that it can mess up your campaign data if you pause, instead of merely lowering your daily budget to nearly $0.
Status – if a campaign has been paused, removed, or is not eligible, this column will report it.
Clicks – the number of clicks this campaign has received in the selected time frame.
- This obviously tells you how effective your ads are in getting people to visit your website/landing page in terms of raw numbers, not ROI
Impressions – the number of times your ad was shown in the selected time frame.
- This is important because the more your ads are shown, the more potential you have to get clicks/new customers/sales. If your ads aren’t being shown, it could still be a good sign because it could mean all you need is a little help, and your campaign has a lot of potential to grow (low impressions could also be a bad sign, indicating your Ad Rank is low, or no one is searching for your targeted keywords).
Search Impression Share – the number of impressions you received divided by the number of impressions you were eligible to receive (but did not for various reasons, usually competition).
- The higher your search impression share, the more clicks you can get, … the lower your impression share, the more potential your account has for improvement. This also gives an indication of how well your ads are showing up compared to competitors (a high Search Imp Share means your ads are showing more often than competition.)
Search LOST Impression Share (rank) – the % of impressions you did not receive due due poor Ad Rank (your ads are ranked by how relevant they are, and by how much you are willing to pay per click for the associated keywords)
- The figure in this column tells you one way you can improve your campaigns, by improving Ad Rank.
Search LOST Impression Share (budget) – the % of impressions you did not receive due to running out of budget (once you run out of daily budget, your ads will stop showing, but for the rest of the day Google will continue counting how many times your ads could have shown.
- This is a simple data point; if you’re missing out on a lot of impressions due to a low budget, you should consider raising it.
CTR (Click Through Rate) – the number of clicks divided by the number of impressions; the higher this %, the more effective your ad is!
Avg. CPC (Average Cost Per Click) – the average amount it costs to receive one click.
- For some niches this can be very, very high ($80+!), but for this campaign, it will most likely cost you between $0.25 and $0.75 each!
Cost – the total amount you have spent in the selected time frame
Avg. Pos. (Average Position) – this is the average position (1, 2, 3, or 4) of your ad in the search results. In many cases you want your ad to show up in position 3-4. Having a higher bid will put you up at the top of the search results, but will cost you more per click.
The rest of the metrics are for Conversions, arguably the most important metric of all. If you are measuring phone calls to your business that come through the campaign, then you actually know what it’s costing you to acquire a new customer. If you have very high click through rate, low cost per click, but no conversions, then your ad is not actually performing well. I’m not going to cover how to set up conversions in your campaign, because I’m afraid it’s quite involved.
That being said, these metrics can still help you out significantly as you do a monthly review on your mini-campaign to see how it is performing, and take steps to improve it.
Two more areas you might want to know about and check each month:
1) Search term report
2) Negative keywords
However, I don’t think they are an area you must know about using this particular strategy. You can do further research, or send us an email and we can explain how to use them.
Congrats on completing the search marketing mini-course!
I hope this strategy will be a great supplement to the other forms of marketing you do for your company, and prove it’s value to you in the coming months.
Do you want get a second look at how your campaigns are doing?
Click the button below to schedule a free consultation.
[/cs_text][/cs_column][/cs_row][/cs_section][cs_section parallax=”false” separator_top_type=”none” separator_top_height=”50px” separator_top_inset=”0px” separator_top_angle_point=”50″ separator_bottom_type=”none” separator_bottom_height=”50px” separator_bottom_inset=”0px” separator_bottom_angle_point=”50″ _label=”Section 3″ style=”margin: 0px;padding: 0px;”][cs_row inner_container=”true” marginless_columns=”false” style=”margin: 0px auto;padding: 0px;”][cs_column fade=”false” fade_animation=”in” fade_animation_offset=”45px” fade_duration=”750″ type=”1/1″ style=”padding: 0px;”][x_button shape=”rounded” size=”global” block=”true” circle=”true” icon_only=”false” href=”https://bookme.name/Beeline” title=”” target=”” info=”none” info_place=”bottom” info_trigger=”hover” info_content=””][x_icon type=”arrow-right” class=”mvn mln mrs”]Schedule Your Consultation[/x_button][/cs_column][/cs_row][/cs_section][cs_section parallax=”false” separator_top_type=”none” separator_top_height=”50px” separator_top_inset=”0px” separator_top_angle_point=”50″ separator_bottom_type=”none” separator_bottom_height=”50px” separator_bottom_inset=”0px” separator_bottom_angle_point=”50″ _label=”Section 4″ style=”margin: 0px;padding: 10px 0px 0px;”][cs_row inner_container=”true” marginless_columns=”false” style=”margin: 0px auto;padding: 0px;”][cs_column fade=”false” fade_animation=”in” fade_animation_offset=”45px” fade_duration=”750″ type=”1/1″ style=”padding: 0px;”] [/cs_column][/cs_row][/cs_section][/cs_content][cs_content_seo]Getting New Clients For $5 or Less
(a 6 day mini-course)
Day 6: Upward (improving ROI)
Before we talk about ongoing improvement, you need to spend a few minutes reviewing the new campaign to be sure it’s complete.
When you’re done reviewing, you’re ready to go live – hit unpause!
Every two to four weeks, you should log-in to your Adwords account and check on your campaign so you can see if it’s doing well and improve it, or decide it’s not helping and pause it.
So how do you know how well your campaign is performing?
In order to analyze the performance of your campaign, you need to understand how to read the data. Here is what it looks like:
If your campaign is brand new, then wait at least 2 weeks to allow the campaign to run; you should get enough data in that time to let you know how to improve.
Before I explain the data, however, we need to consider the date range. I suggest you look at the last 30 days. See here for where you can adjust that date range:
Next you need to select the columns that will be most helpful to understand how your campaign is performing. Each column title has a small box with a “? in it — if you click on that box, you’ll get more info. about what each metric means. I suggest you set your columns to show the following (and hide the rest):
Budget
Status
Campaign Type
Campaign Subtype
Clicks
Impr (Impressions)
Search Impr Share
Search Lost IS (rank)
Search Lost IS (budget)
CTR
Avg CPC
Cost
Avg Pos (Position)
Conversions
Cost/ conv
Conv rate
Conv. value / cost
In order to change which columns you can see, click here on the columns box:
Then you will see this screen. On the very right (highlighted/in white) are the columns you currently have selected; to remove one just click the ‘X’. You can access the available columns (center) from the menus on the very left. Use the above picture to adjust which columns to select, and which to remove.
Here is what each of these data points mean for your campaign, and how to use the data to improve your campaign.
Budget – the campaign’s daily budget
*Advanced trick – if you want to pause a campaign, instead of pausing it, lower your daily budget to $.01 instead. It has been shown that it can mess up your campaign data if you pause, instead of merely lowering your daily budget to nearly $0.
Status – if a campaign has been paused, removed, or is not eligible, this column will report it.
Clicks – the number of clicks this campaign has received in the selected time frame.
This obviously tells you how effective your ads are in getting people to visit your website/landing page in terms of raw numbers, not ROI
Impressions – the number of times your ad was shown in the selected time frame.
This is important because the more your ads are shown, the more potential you have to get clicks/new customers/sales. If your ads aren’t being shown, it could still be a good sign because it could mean all you need is a little help, and your campaign has a lot of potential to grow (low impressions could also be a bad sign, indicating your Ad Rank is low, or no one is searching for your targeted keywords).
Search Impression Share – the number of impressions you received divided by the number of impressions you were eligible to receive (but did not for various reasons, usually competition).
The higher your search impression share, the more clicks you can get, … the lower your impression share, the more potential your account has for improvement. This also gives an indication of how well your ads are showing up compared to competitors (a high Search Imp Share means your ads are showing more often than competition.)
Search LOST Impression Share (rank) – the % of impressions you did not receive due due poor Ad Rank (your ads are ranked by how relevant they are, and by how much you are willing to pay per click for the associated keywords)
The figure in this column tells you one way you can improve your campaigns, by improving Ad Rank.
Search LOST Impression Share (budget) – the % of impressions you did not receive due to running out of budget (once you run out of daily budget, your ads will stop showing, but for the rest of the day Google will continue counting how many times your ads could have shown.
This is a simple data point; if you’re missing out on a lot of impressions due to a low budget, you should consider raising it.
CTR (Click Through Rate) – the number of clicks divided by the number of impressions; the higher this %, the more effective your ad is!
Avg. CPC (Average Cost Per Click) – the average amount it costs to receive one click.
For some niches this can be very, very high ($80+!), but for this campaign, it will most likely cost you between $0.25 and $0.75 each!
Cost – the total amount you have spent in the selected time frame
Avg. Pos. (Average Position) – this is the average position (1, 2, 3, or 4) of your ad in the search results. In many cases you want your ad to show up in position 3-4. Having a higher bid will put you up at the top of the search results, but will cost you more per click.
The rest of the metrics are for Conversions, arguably the most important metric of all. If you are measuring phone calls to your business that come through the campaign, then you actually know what it’s costing you to acquire a new customer. If you have very high click through rate, low cost per click, but no conversions, then your ad is not actually performing well. I’m not going to cover how to set up conversions in your campaign, because I’m afraid it’s quite involved.
That being said, these metrics can still help you out significantly as you do a monthly review on your mini-campaign to see how it is performing, and take steps to improve it.
Two more areas you might want to know about and check each month:
1) Search term report
2) Negative keywords
However, I don’t think they are an area you must know about using this particular strategy. You can do further research, or send us an email and we can explain how to use them.
Congrats on completing the search marketing mini-course!
I hope this strategy will be a great supplement to the other forms of marketing you do for your company, and prove it’s value to you in the coming months.
Do you want get a second look at how your campaigns are doing?
Click the button below to schedule a free consultation.
Schedule Your Consultation  [/cs_content_seo]